#r# ====================
#r# Bipolar Transistor
#r# ====================
#r# This example shows how to simulate the characteristic curves of a bipolar transistor.
# Fixme: Complete
####################################################################################################
import numpy as np
import matplotlib.pyplot as plt
####################################################################################################
import PySpice.Logging.Logging as Logging
logger = Logging.setup_logging()
####################################################################################################
from PySpice.Doc.ExampleTools import find_libraries
from PySpice.Probe.Plot import plot
from PySpice.Spice.Library import SpiceLibrary
from PySpice.Spice.Netlist import Circuit
from PySpice.Unit import *
####################################################################################################
libraries_path = find_libraries()
spice_library = SpiceLibrary(libraries_path)
####################################################################################################
figure, ((ax1, ax2), (ax3, ax4)) = plt.subplots(2, 2, figsize=(20, 10))
####################################################################################################
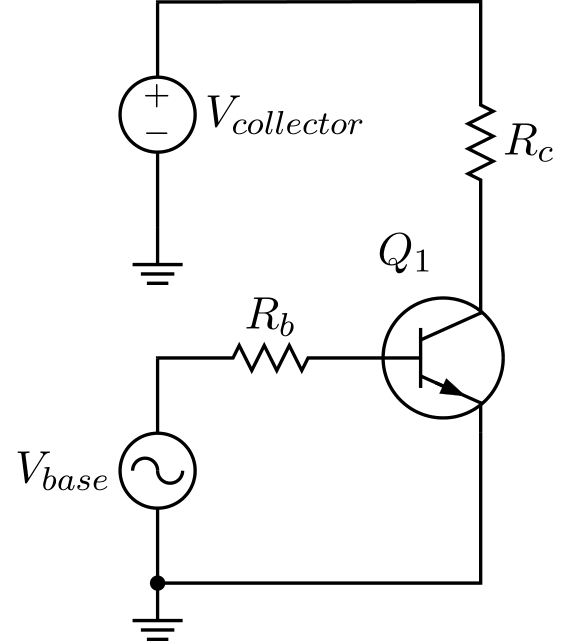
#r# We define a basic circuit to drive an NPN transistor (2n2222a) using two voltage sources.
#f# circuit_macros('transistor.m4')
circuit = Circuit('Transistor')
Vbase = circuit.V('base', '1', circuit.gnd, 1@u_V)
circuit.R('base', 1, 'base', 1@u_kΩ)
Vcollector = circuit.V('collector', '2', circuit.gnd, 0@u_V)
circuit.R('collector', 2, 'collector', 1@u_kΩ)
# circuit.BJT(1, 'collector', 'base', circuit.gnd, model='generic')
# circuit.model('generic', 'npn')
circuit.include(spice_library['2n2222a'])
circuit.BJT(1, 'collector', 'base', circuit.gnd, model='2n2222a')
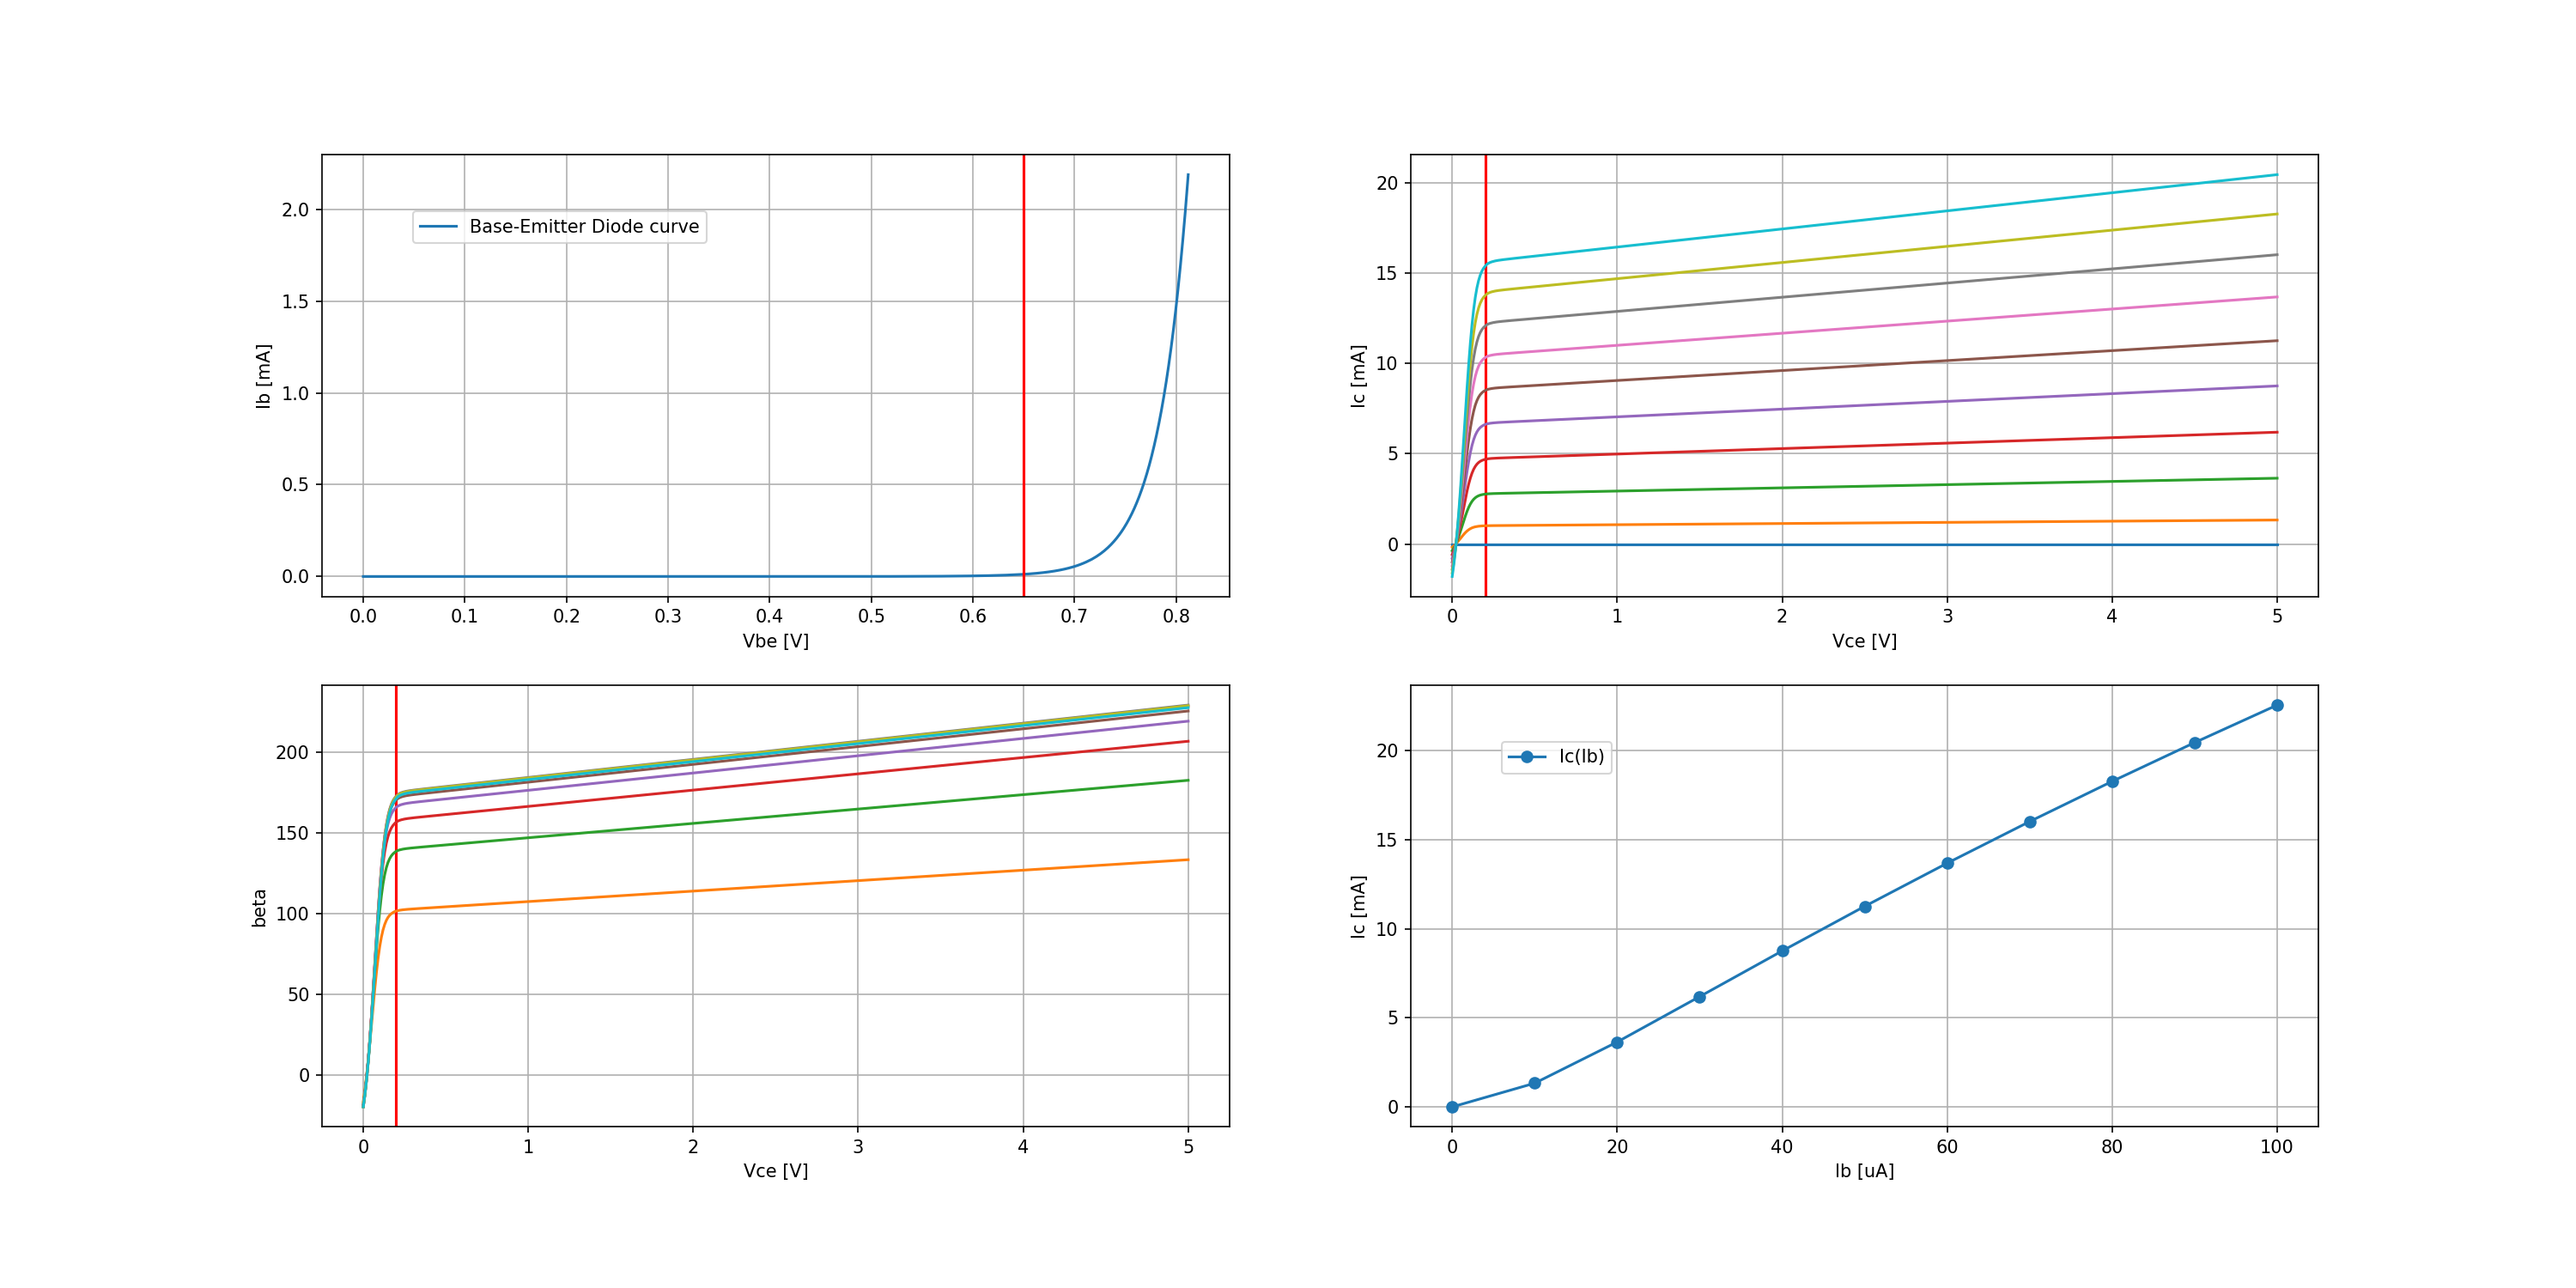
#r# We plot the base-emitter diode curve :math:`Ib = f(Vbe)` using a DC sweep simulation.
simulator = circuit.simulator(temperature=25, nominal_temperature=25)
analysis = simulator.dc(Vbase=slice(0, 3, .01))
ax1.plot(analysis.base, u_mA(-analysis.Vbase)) # Fixme: I_Vbase
ax1.axvline(x=.65, color='red')
ax1.legend(('Base-Emitter Diode curve',), loc=(.1,.8))
ax1.grid()
ax1.set_xlabel('Vbe [V]')
ax1.set_ylabel('Ib [mA]')
####################################################################################################
#r# We will now replace the base's voltage source by a current source in the previous circuit.
circuit = Circuit('Transistor')
Ibase = circuit.I('base', circuit.gnd, 'base', 10@u_uA) # take care to the orientation
Vcollector = circuit.V('collector', 'collector', circuit.gnd, 5)
# circuit.BJT(1, 'collector', 'base', circuit.gnd, model='generic')
# circuit.model('generic', 'npn')
circuit.include(spice_library['2n2222a'])
circuit.BJT(1, 'collector', 'base', circuit.gnd, model='2n2222a')
# Fixme: ngspice doesn't support multi-sweep ???
# it works in interactive mode
#?# simulator = circuit.simulator(temperature=25, nominal_temperature=25)
#?# analysis = simulator.dc(Vcollector=slice(0, 5, .1), Ibase=slice(micro(10), micro(100), micro(10)))
#?# 0 v(i-sweep) voltage # Vcollector in fact
#?# 1 v(collector) voltage
#?# 2 v(base) voltage
#?# 3 i(vcollector) current
#?# 0.00000000e+00, 1.00000000e-01, 2.00000000e-01, 3.00000000e-01, 4.00000000e-01, 5.00000000e-01, 6.00000000e-01, 7.00000000e-01, 8.00000000e-01, 9.00000000e-01
#?# 0.00000000e+00, 1.00000000e-01, 2.00000000e-01, 3.00000000e-01, 4.00000000e-01, 5.00000000e-01, 6.00000000e-01, 7.00000000e-01, 8.00000000e-01, 9.00000000e-01
#?# 6.50478604e-01, 7.40522920e-01, 7.68606463e-01, 7.69192913e-01, 7.69049191e-01, 7.69050844e-01, 7.69049584e-01, 7.69049559e-01, 7.69049559e-01, 7.69049559e-01
#?# 9.90098946e-06, -3.15540984e-04, -9.59252614e-04, -9.99134834e-04, -9.99982226e-04, -1.00005097e-03, -1.00000095e-03, -9.99999938e-04, -9.99999927e-04, -9.99999937e-04
#?#
#?# analysis = simulator.dc(Vcollector=slice(0, 10, .1))
#?# 0 v(v-sweep) voltage
#?# 1 v(collector) voltage
#?# 2 v(base) voltage
#?# 3 i(vcollector) current
#?#
#?# analysis = simulator.dc(Ibase=slice(micro(10), micro(100), micro(10)))
#?# 0 v(i-sweep) voltage
#?# 1 v(collector) voltage
#?# 2 v(base) voltage
#?# 3 i(vcollector) current
ax2.grid()
# ax2.legend(('Ic(Vce, Ib)',), loc=(.5,.5))
ax2.set_xlabel('Vce [V]')
ax2.set_ylabel('Ic [mA]')
ax2.axvline(x=.2, color='red')
ax3.grid()
# ax3.legend(('beta(Vce)',), loc=(.5,.5))
ax3.set_xlabel('Vce [V]')
ax3.set_ylabel('beta')
ax3.axvline(x=.2, color='red')
for base_current in np.arange(0, 100, 10):
base_current = base_current@u_uA
Ibase.dc_value = base_current
simulator = circuit.simulator(temperature=25, nominal_temperature=25)
analysis = simulator.dc(Vcollector=slice(0, 5, .01))
# add ib as text, linear and saturate region
# Plot Ic = f(Vce)
ax2.plot(analysis.collector, u_mA(-analysis.Vcollector))
# Plot β = Ic / Ib = f(Vce)
ax3.plot(analysis.collector, -analysis.Vcollector/float(base_current))
# trans-resistance U = RI R = U / I = Vce / Ie
# ax3.plot(analysis.collector, analysis.sweep/(float(base_current)-analysis.Vcollector))
# Fixme: sweep is not so explicit
#r# Let plot :math:`Ic = f(Ib)`
ax4.grid()
ax4.set_xlabel('Ib [uA]')
ax4.set_ylabel('Ic [mA]')
simulator = circuit.simulator(temperature=25, nominal_temperature=25)
analysis = simulator.dc(Ibase=slice(0, 100e-6, 10e-6))
# Fixme: sweep
ax4.plot(analysis.sweep*1e6, u_mA(-analysis.Vcollector), 'o-')
ax4.legend(('Ic(Ib)',), loc=(.1,.8))
####################################################################################################
plt.tight_layout()
plt.show()
#f# save_figure('figure', 'transistor-plot.png')
8.20.3. Bipolar Transistor
This example shows how to simulate the characteristic curves of a bipolar transistor.
# Fixme: Complete


import numpy as np
import matplotlib.pyplot as plt


import PySpice.Logging.Logging as Logging
logger = Logging.setup_logging()


from PySpice.Doc.ExampleTools import find_libraries
from PySpice.Probe.Plot import plot
from PySpice.Spice.Library import SpiceLibrary
from PySpice.Spice.Netlist import Circuit
from PySpice.Unit import *


libraries_path = find_libraries()
spice_library = SpiceLibrary(libraries_path)


figure, ((ax1, ax2), (ax3, ax4)) = plt.subplots(2, 2, figsize=(20, 10))
We define a basic circuit to drive an NPN transistor (2n2222a) using two voltage sources.
circuit = Circuit('Transistor')

Vbase = circuit.V('base', '1', circuit.gnd, 1@u_V)
circuit.R('base', 1, 'base', 1@u_kΩ)
Vcollector = circuit.V('collector', '2', circuit.gnd, 0@u_V)
circuit.R('collector', 2, 'collector', 1@u_kΩ)
# circuit.BJT(1, 'collector', 'base', circuit.gnd, model='generic')
# circuit.model('generic', 'npn')
circuit.include(spice_library['2n2222a'])
circuit.BJT(1, 'collector', 'base', circuit.gnd, model='2n2222a')
We plot the base-emitter diode curve \(Ib = f(Vbe)\) using a DC sweep simulation.
simulator = circuit.simulator(temperature=25, nominal_temperature=25)
analysis = simulator.dc(Vbase=slice(0, 3, .01))

ax1.plot(analysis.base, u_mA(-analysis.Vbase)) # Fixme: I_Vbase
ax1.axvline(x=.65, color='red')
ax1.legend(('Base-Emitter Diode curve',), loc=(.1,.8))
ax1.grid()
ax1.set_xlabel('Vbe [V]')
ax1.set_ylabel('Ib [mA]')
We will now replace the base’s voltage source by a current source in the previous circuit.
circuit = Circuit('Transistor')
Ibase = circuit.I('base', circuit.gnd, 'base', 10@u_uA) # take care to the orientation
Vcollector = circuit.V('collector', 'collector', circuit.gnd, 5)
# circuit.BJT(1, 'collector', 'base', circuit.gnd, model='generic')
# circuit.model('generic', 'npn')
circuit.include(spice_library['2n2222a'])
circuit.BJT(1, 'collector', 'base', circuit.gnd, model='2n2222a')

# Fixme: ngspice doesn't support multi-sweep ???
#   it works in interactive mode


ax2.grid()
# ax2.legend(('Ic(Vce, Ib)',), loc=(.5,.5))
ax2.set_xlabel('Vce [V]')
ax2.set_ylabel('Ic [mA]')
ax2.axvline(x=.2, color='red')

ax3.grid()
# ax3.legend(('beta(Vce)',), loc=(.5,.5))
ax3.set_xlabel('Vce [V]')
ax3.set_ylabel('beta')
ax3.axvline(x=.2, color='red')

for base_current in np.arange(0, 100, 10):
    base_current = base_current@u_uA
    Ibase.dc_value = base_current
    simulator = circuit.simulator(temperature=25, nominal_temperature=25)
    analysis = simulator.dc(Vcollector=slice(0, 5, .01))
    # add ib as text, linear and saturate region
    # Plot Ic = f(Vce)
    ax2.plot(analysis.collector, u_mA(-analysis.Vcollector))
    # Plot β = Ic / Ib = f(Vce)
    ax3.plot(analysis.collector, -analysis.Vcollector/float(base_current))
    # trans-resistance U = RI   R = U / I = Vce / Ie
    # ax3.plot(analysis.collector, analysis.sweep/(float(base_current)-analysis.Vcollector))
    # Fixme: sweep is not so explicit
Let plot \(Ic = f(Ib)\)
ax4.grid()
ax4.set_xlabel('Ib [uA]')
ax4.set_ylabel('Ic [mA]')

simulator = circuit.simulator(temperature=25, nominal_temperature=25)
analysis = simulator.dc(Ibase=slice(0, 100e-6, 10e-6))
# Fixme: sweep
ax4.plot(analysis.sweep*1e6, u_mA(-analysis.Vcollector), 'o-')
ax4.legend(('Ic(Ib)',), loc=(.1,.8))


plt.tight_layout()
plt.show()